
This work is licensed under a Creative Commons Attribution 4.0 International License that allows sharing, adapting, and remixing.
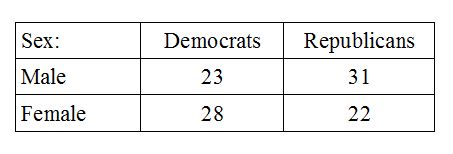
In some research situations we might want to compare the frequency of people across two simultaneous categories. For example, we could compare the frequencies of males and females who identify as either Democrats or Republicans. A second example would be to compare the number of smokers and nonsmokers who are either high income or low income. The two category variables would yield at least four possible groups, such as male Democrats, male Republicans, female Democrats, and female Republicans. The data are nominal scale data, which means that we are simply counting the number of people in each category.
This double classification scheme goes beyond the simple listing of frequencies that was done with the Frequencies command. The Crosstabs command is used for these analyses.
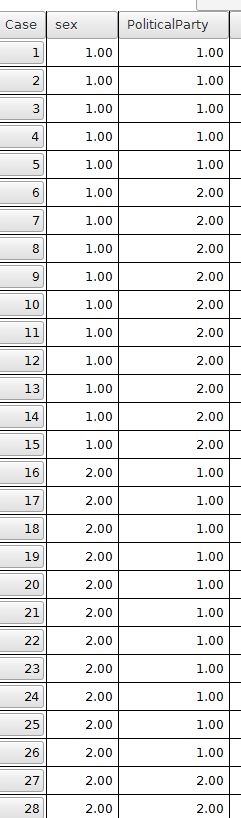
A Crosstabs analysis will require two categorical variables that are appropriately coded to represent group membership. For the above example, a Sex variable could could be coded as 1 = male and 2 = female. Likewise, Political Party could be coded as 1 = Democrat and 2 = Republican. Altogether, male Democrats would be coded as 1 (Sex) and 1 (PoliticalParty). Female Democrts would be coded as 2 (Sex) and 1 (PoliticalParty). The remaining groups would be coded as 1, 2 (male Republicans) and 2, 2 (female Republicans). The data file for this coding would look something like this:
Index | Next - Crosstabs Command
This work is licensed under a Creative Commons Attribution 4.0 International License that allows sharing, adapting, and remixing.