
This work is licensed under a Creative Commons Attribution 4.0 International License that allows sharing, adapting, and remixing.
The most common analysis for relationships are to conduct correlation coefficients. This will give us a score between -1.0 and +1.0.
The score sign tells the kind of relationship, with positive relationships meaning that both variables increase together. Negative relationships occur in situations where an increase in one variable is connected to a decrease in the other variable. In other words, the variables are headed in opposite directions.
The numerical value of the correlation coefficient indicates stronger relationships as it gets farther from zero, in either the positive or negative direction.
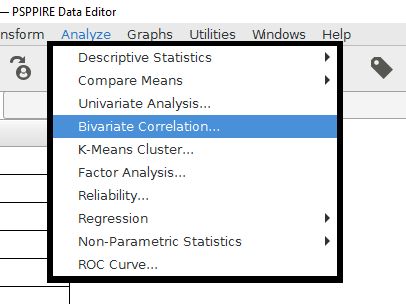
The PSPP feature for doing simple correlation coefficients is Bivariate Correlation. The prefix "bi" refers to two, so this analysis will be correlations between two variables. This command will compute Pearson's r, which is the most commonly used correlation coefficient.
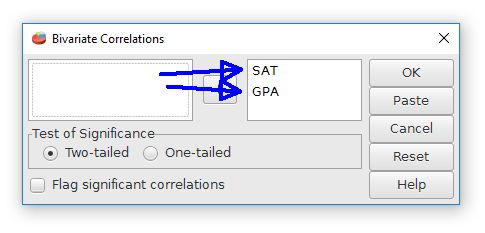
Like most analyses, we have to choose the variables that we want to correlate. Drag these variables to the open field on the right. It's possible to add more than two variables. PSPP will make a table that will calculate all of the possible correlations between the variables.
The "test of significance" and "flag" features are for computing the statistical significance of these variables. A two-tailed test is for open ended predictions. One-tailed is for situations with specific predictions.
The output has a table that shows the correlation coefficients for all of the possible comparisons between the selected variables. The intersections of the rows and columns show the comparisons for the variables. Pearson r for the relationship between GPA and SAT in this example is +.78, which is strong for behavioral data. The p value is in the "Sig. (2-tailed)" row, with "sig." being short for statistical significance.
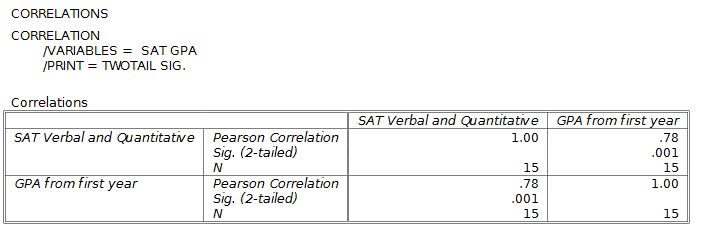
Notice that each variable has a correlation with itself of +1.0, a perfect relationship. This is not a useful analysis, so just ignore it.
APA style has specific recommendations for reporting statistics. For correlations, the format is r(degrees of freedom) = r score, p = probability. The degrees of freedom for correlations are the total number of score pairs (N) minus two. For this example, the degrees of freedom would be df = 15 - 2 = 13. Also note that r and p are in italic font. The probability is shown in the Sig. (2-tailed) field of the output. Altogether, the proper APA style for reporting this result is r(13) = .78, p = .001.
Index | Next - Linear Regression
This work is licensed under a Creative Commons Attribution 4.0 International License that allows sharing, adapting, and remixing.