This page reports the area values from a standard normal curve table. This area is used for probability and estimating relative frequencies.
*** Waiting for results ***
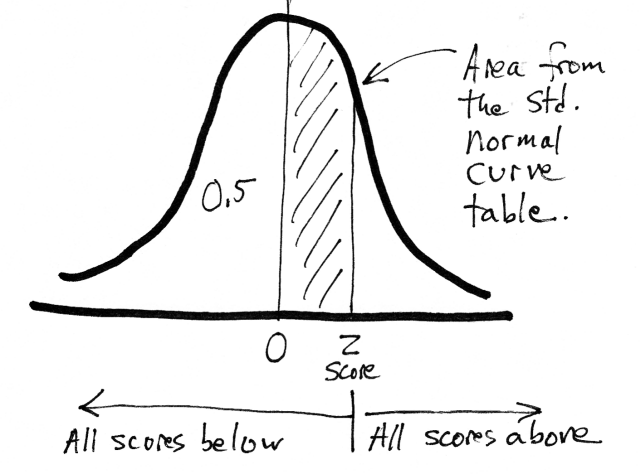
This looks-up the area between 0 (the population mean and center) and a z score on the standard normal curve. This value can be used to estimate relative frequencies or probabilities. For negative scores, the curve is essentially flipped on the vertical axis. The curve is symmetrical, so the areas from the negative scores are the same as the positive scores.
Creative Commons Attribution 4.0 International License that allows sharing, adapting, and remixing.