This page looks-up critical t-score values from the t score table to facilitate decisions about statistical significance.
Select the number of tails.
Select the desired p value.
*** Waiting for results ***
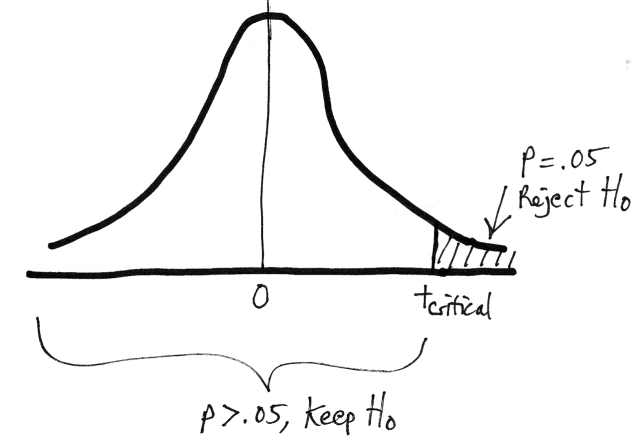
Statistical significance is a way of saying that the null hypothesis is unlikely to be true. These situations have probabilities that will be in the tails of the t-distribution. So where does the tail part begin? The critical value defines where statistical significance would begin.
For one-tailed tests (for a prediction of higher scores):
For two-tailed tests:
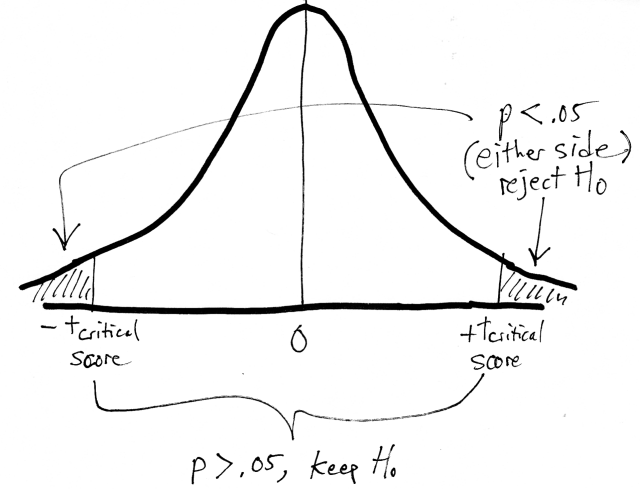
Obtained t-test scores that are more extreme than the tcritical value are statistically significant. If your calculated t score (tobtained) goes beyond tcritical, then p < .05 and the null hypothesis is rejected. In other words, your t score is out in the tail region and unlikely to occur by chance. Otherwise, when tobtained is less tcritical the p value is p > .05 and the null hypothesis is kept. These outcomes are in the middle (near t = 0) and are likely to occur by chance.
Creative Commons Attribution 4.0 International License that allows sharing, adapting, and remixing.