
This work is licensed under a Creative Commons Attribution 4.0 International License that allows sharing, adapting, and remixing.
Let's say that we want to know how many males and females we have in our class. This can be easily accomplished by using the Frequencies command. This is the output for the Sex variable with the default values of the Frequencies command.
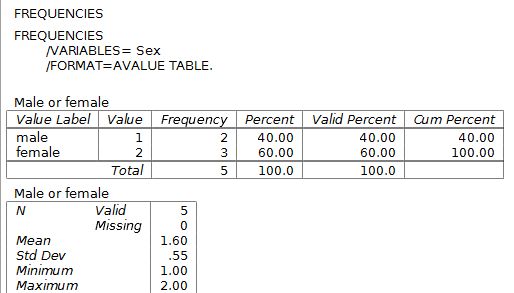
The frequencies table has some useful information, such as the frequencies and percentages of each sex.
The bottom table, however, is problematic. How should we interpret a mean sex of 1.6? This is an improper application of the mean calculation. A mean calculated from a nominal scale variable (i.e., categories) just doesn't tell us anything useful. This is a beginner-level mistake.
This is a cautionary example of how PSPP and other statistical programs can be misused. The software does an amazing job of performing calculations but it has no ability to judge whether a particular analysis is appropriate for the situation at hand. It's up to you, the statistician, to use good judgment about which analysis is appropriate.
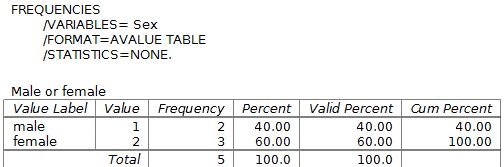
A better way to do the present analysis would be to uncheck the default statistics like mean and standard deviation in the frequencies dialog box. We don't want a mean or standard deviation for nominal data such as membership in a category. To request these analyses will be asking for trouble.
Here is the better, more appropriate analysis that shows just the frequency table. The defaults for mean and standard deviation were unchecked to eliminate the unnecessary calculations.
Index | Next - The Descriptives Command
This work is licensed under a Creative Commons Attribution 4.0 International License that allows sharing, adapting, and remixing.