
This work is licensed under a Creative Commons Attribution 4.0 International License that allows sharing, adapting, and remixing.
The t-test is limited to comparing two groups or conditions. A different kind of statistical test must be used if there are three or more groups that need to be compared.
Analysis of Variance, or ANOVA, was invented by Sir Ronald Fisher to simultaneously compare the results from several groups. The most basic version of ANOVA compares groups that vary in a single dimension, or factor. This is called one-way ANOVA. A more advanced version of ANOVA is available for experiments that have two or more factors.
In PSPP, a one-way ANOVA must have a dependent variable for the data. A second variable is needed to represent the group membership. This approach is similar to the setup for an independent-samples t-test.
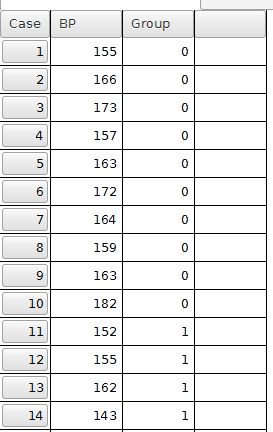
In this example, let's pretend that a drug is being tested to treat high blood pressure. Hypertensive individuals are randomly assigned to groups that get no drug (control), a low dose, medium dose, or high dose.
Part of the example data are shown below, with some data omitted to save space. The BP variable represents systolic blood pressure. The Group variable has group membership represented by 0, 1, 2, or 3 for a zero, low, medium, or high dose, respectively. The data file is available for downloading.
The one-way ANOVA test is started by selecting Analyze, Compare Means, then One-Way ANOVA. The dialog box requires users to select the dependent variable and move it to the central Dependent Variable field. The variable representing the groups must be moved to the Factor field. This organization is similar to the dialog box used for the independent-samples t-test.
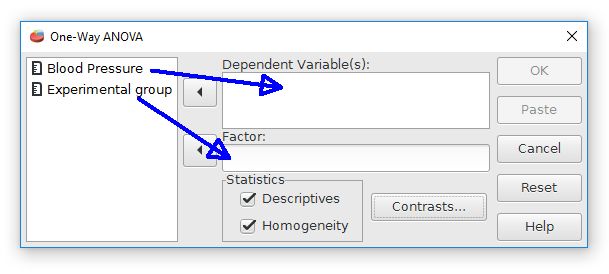
PSPP also provides check boxes for "descriptives" and "homogeneity". This is useful information to have, so let's check these boxes.
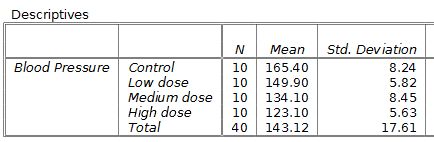
The output begins with some basic descriptive statistics, such as the mean and standard deviation for each group.
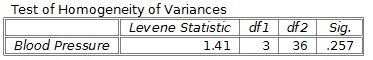
The next part of the output shows the homogeneity of variance test. ANOVA assumes that the groups have variances that are similar. If the results of this test are significant, it would suggest that the group variances are significantly different, so ANOVA might not be an appropriate test. Fortunately, the homogeneity test is not significant for this current example. It will be okay to use an ANOVA test.
The final part shows the ANOVA results.
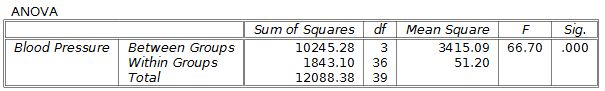
The F score statistic and the p value are shown on the right side. This result would be statistically significant because p < .05. The sums of squares and mean squares results are sometimes used for further analyses, such as calculating effect sizes.
The format for reporting ANOVA results in APA style is F(degrees of freedom - between, degrees of freedom - within) = F score, p = p value. For this example, the results would be reported as F(3, 36) = 66.7, p < .001.
Index | Next - Chi Square Goodness of Fit
This work is licensed under a Creative Commons Attribution 4.0 International License that allows sharing, adapting, and remixing.