The starting point for most statistical analyses is a description of the data. The aim is to summarize the data into a big-picture or bird's-eye view of what the typical participant is like. This set of PSPP commands will focus on simple descriptive statistics such as measures of central tendency, variability, and graphs.
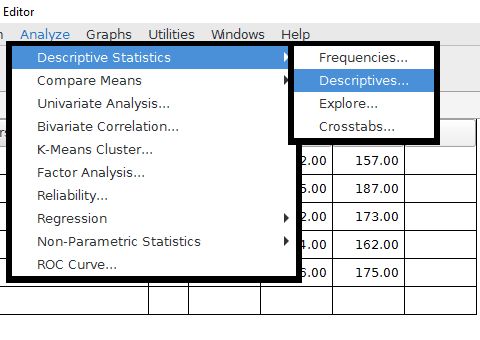
The analyze menu is where most of our essential commands are stored. A few other commands for graphs are located in a graphs drop-down menu. Most of the descriptive statistics that we will be using are located in the Descriptive Statistics folder of the Analyze drop-down menu.
Home | Start | Variables | Data | Descriptive | Relationship | Inferential | Effect size | Advanced | Video
This work is licensed under a Creative Commons Attribution 4.0 International License that allows sharing, adapting, and remixing.