Another way to analyze frequencies involves more complicated classification schemes. Crosstabs (short for cross tabulation) is for using two variables to determine categories. The intersections of the two classifying variables will have frequency analyses. Like the previous frequency command, this is for nominal scale data, meaning a simple count of people in each category.
For example, we could compare the frequencies of males and females who identify as either Democrats or Republicans. A second example would be to compare the number of smokers and nonsmokers who are either high income or low income.
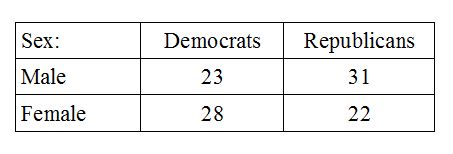
Using two categorical variables for classification will yield at least four possible groups, such as male Democrats, male Republicans, female Democrats, and female Republicans. The following contingency table shows possible combinations.along with the frequency. For example, there are 23 male Democrats.
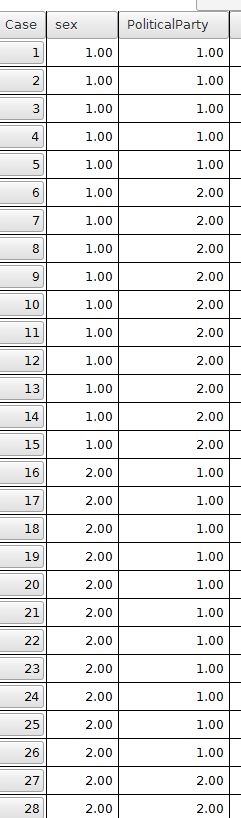
A Crosstabs analysis will require two categorical variables that are appropriately coded to represent group membership. For the above example, a Sex variable could could be coded as 1 = male and 2 = female. Likewise, Political Party could be coded as 1 = Democrat and 2 = Republican. Altogether, male Democrats would be coded as 1 (Sex) and 1 (PoliticalParty). Female Democrats would be coded as 2 (Sex) and 1 (PoliticalParty). The remaining groups would be coded as 1, 2 (male Republicans) and 2, 2 (female Republicans). The resulting data file with this coding is shown below.
Home | Start | Variables | Data | Descriptive | Relationship | Inferential | Effect size | Advanced | Video
This work is licensed under a Creative Commons Attribution 4.0 International License that allows sharing, adapting, and remixing.