The Descriptives command is a good all-purpose option for basic describes statistics, such as measures of central tendency and variability. It is similar to the Frequencies command but lacks the frequencies table.
This command is available from Analyze > Descriptive Statistics > Descriptives. You can try this analysis by using the file psppFile.sav.
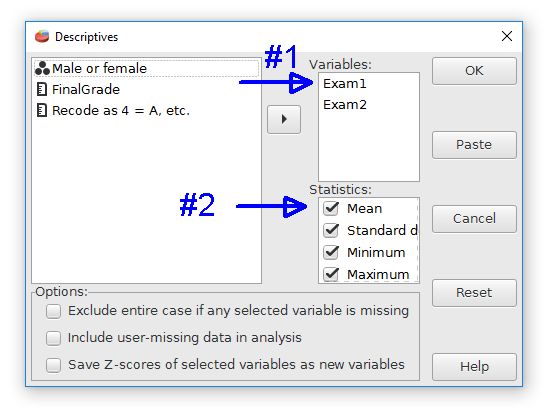
Choose the variables first by moving them to the Variables column. Next, the desired analyses can be selected by checking the boxes. Some advanced options are available at the bottom.
Here is the output for the Exam1 and Exam2 variables with the Descriptives command. This output uses the default analyses.
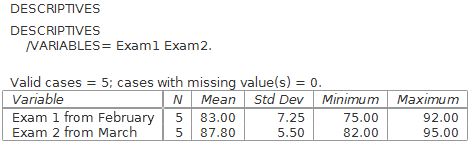
An oddity of the Descriptives command is that the central tendency measures of mode or median are not produced. These descriptive statistics are only available from the the Analyze > Descriptive Statistics > Frequencies command.
Home | Start | Variables | Data | Descriptive | Relationship | Inferential | Effect size | Advanced | Video
This work is licensed under a Creative Commons Attribution 4.0 International License that allows sharing, adapting, and remixing.