The Frequencies command can create a wide range of descriptive statistics: Frequency tables, central tendency, and even graphs. As the name suggests, this tool is primarily used to analyze the frequencies and percentages of scores.
Begin by selecting Analyze > Descriptive Statistics > Frequencies. The dialog box will look like this:
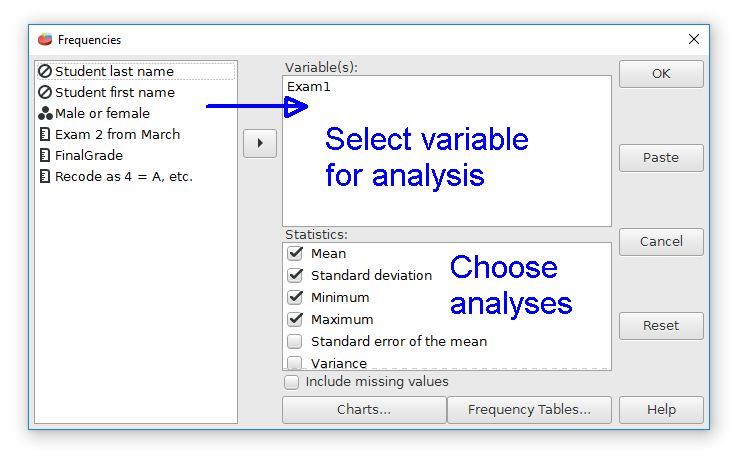
The first step is to choose the variable that will be analyzed. Move this variable from the list on the left to the Variable(s) field. We are using Exam1 for our example. If you'd like to try it, download the file psppFile.sav.
The next step is to choose the desired descriptive statistics by checking the ones that you want. The Charts button has some options for choosing histograms, bar charts, and pie charts. The Frequencies Table button has options for organizing the frequencies list, such as ascending or descending order. Clicking the "OK" button will perform the analysis.
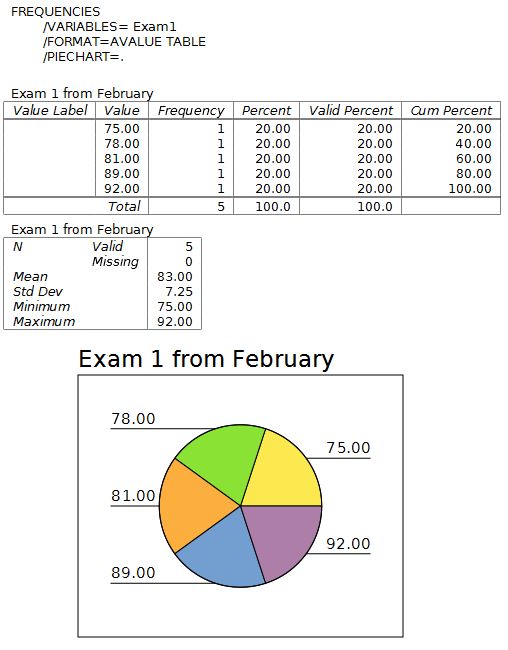
Switch to the output window to see the results of the analysis. The upper part of the output has the commands that are used by PSPP. The first table has each score with the frequency, percentage, valid percentage, and cumulative percentage. The frequencies count how many time a particular score occurs. Each score in our example occurs one time.
Valid percentage is a percentage that ignores cells with missing data. The next table has some basic descriptive statistics. Cumulative percentage adds all the scores at or below a particular value.
The last part is a pie chart that was produced by selecting the pie chart option.
Home | Start | Variables | Data | Descriptive | Relationship | Inferential | Effect size | Advanced | Video
This work is licensed under a Creative Commons Attribution 4.0 International License that allows sharing, adapting, and remixing.