For the paired-samples t-test, the comparisons are reflected in the difference scores. An example is that a participant in an experiment shows a change when before and after the experiment are compared.
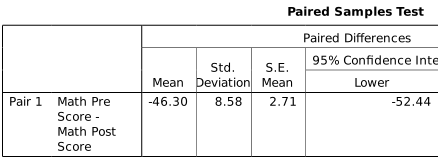
Start by conducting the paired-samples t-test. The mean difference scores are shown in the descriptive statistics. Use these values in the calculator fields below. This example is from the paired-samples t-test.
*** Waiting for results ***
The Cohen's d calculation for dependent-samples t tests are the difference score mean divided by the difference score standard deviation: MD / SDD.
Suggested effect size interpretation (Sawilowsky, 2009):
These value labels are not meant to be absolute standards. The interpretation depends upon the research context.
Datanovia.com T-test Effect Size using Cohen's d Measure
Sawilowsky, S.S. (2009). New effect size rules of thumb. Journal of Modern Applied Statistical Methods. 8(2), 597-599. https://doi.org/10.22237/jmasm/1257035100
Home | Start | Variables | Data | Descriptive | Relationship | Inferential | Effect size | Advanced | Video
This work is licensed under a Creative Commons Attribution 4.0 International License that allows sharing, adapting, and remixing.