Cohen's d is the effect size statistic commonly used for t-tests. There is a slightly different version available for each form of the t-test, so choose these carefully. Cohen's d values of zero mean no effect. Values greater than zero show larger effects. See the interpretation scale below for more details.
To begin, we will assume that you have already conducted a one-sample t-test. The descriptive statistics results from the output window is then used to calculate Cohen's d. This web page can do the calculations for you if the descriptive statistics are known.
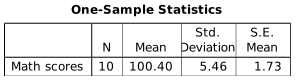
An example output from a one-sample t-test is shown below. This is from the one-sample t-test example in which the sample had an average score of 100.49 and the standard value for camparison was a population mean of 100. These descriptive values will be needed for calculating the Cohen's d statistic.
To calculate Cohen's d, copy the descriptive statistics to the below fields. The default values from the above example have already been entered. Click on the "Compute Cohen's d" button to calculate the statistic. The results will appear in the green area below the button. This example produces a Cohen's d statistic of nearly zero, thereby showing almost no effect.
*** Waiting for results ***
Use the following verbal descriptions of effect size when writing your results.
The formula is the classic, simple Cohen's d: d = (M1 - M2) / SD
Suggested effect size interpretation (Sawilowsky, 2009):
These value labels are not meant to be absolute standards. The interpretation depends upon the research context.
Sawilowsky, S.S. (2009). New effect size rules of thumb. Journal of Modern Applied Statistical Methods. 8(2), 597-599. https://doi.org/10.22237/jmasm/1257035100
Home | Start | Variables | Data | Descriptive | Relationship | Inferential | Effect size | Advanced | Video
This work is licensed under a Creative Commons Attribution 4.0 International License that allows sharing, adapting, and remixing.