The chi-squared test is for comparing the frequencies of people in different categories. For example, are there equal or unequal numbers of men and women attending college? This purpose differs from the t-test in that counting occurrences in a category is a nominal scale form of data.
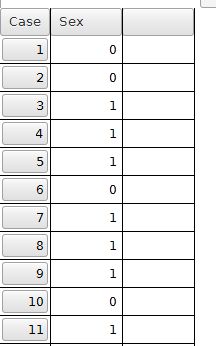
The data file will need to code the group membership. In this example we have sampled 20 college students. The sex of each student is recorded as a 0 (male) or 1 (female). Some of the data are shown below. The data file is available for downloading.
The chi-square goodness of fit test is available in PSPP through the Analyze > Non-parametric Statistics > chi-square command. The dialog box looks like this screenshot:
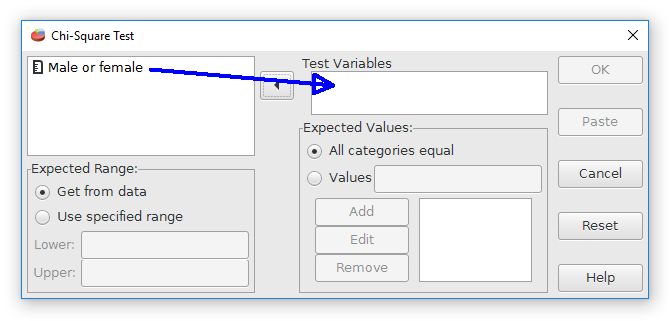
Move the variable for the group membership to the test variable field. For expected values, we will assume that each group has an equal number of people (50% males, 50% females) if everything is random. This is a null hypothesis prediction.
For some research questions it might be expected that the groups match a population value that is not exactly equal. The dialog box can be adjusted for these situations where a sample is expected to have a particular group size based upon pre-existing evidence.
Pressing the OK button will calculate the test results, which look like this:
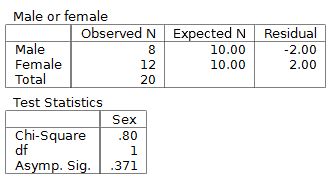
The results begin with descriptive statistics, which are a count of people in each category. The chi square test for this example is not statistically significant because the p value, shown as "Asymp. Sig.", is p = .371.
Home | Start | Variables | Data | Descriptive | Relationship | Inferential | Effect size | Advanced | Video
This work is licensed under a Creative Commons Attribution 4.0 International License that allows sharing, adapting, and remixing.