One-sample t-tests are used for comparing data from a sample to population data. For example, the local school system might want to compare standardized test scores from local students to a state or national average. This would address the question of whether local students are the same (null hypothesis) or different (alternative hypothesis, nondirectional) than the population.
Let's pretend that the data in the OneSample column of the ttestExamples.sav file are the standardized math test scores from 10 ninth grade students at the local high school. These can be compared to a national average, which we will say is 100. The null hypothesis is that our local students are equal or similar to the national average. The alternative hypothesis is that they are different from the national average, being either higher or lower.
Begin this analysis by going to the Analyze menu, then the Compare Means folder. Select the One Sample T-test command. The one-sample t-test dialog box looks like this screenshot:
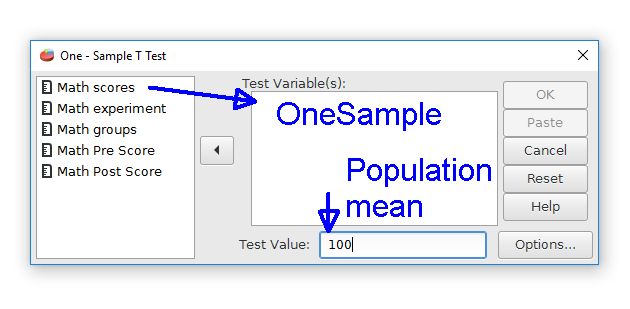
The first step is to choose the desired data variable from the list on the left by moving it to the Test Variable(s) field. The "Math Scores" label represents the OneSample variable. Move this variable right to the Test Variable(s) field.
The second step is that we must provide the population mean value. This is the comparison value that our sample will be compared to. Enter 100 in the Test Value field to represent the population mean for the current example. If no mean is given, PSPP will assume that the population mean is zero.
The output is a table with descriptive statistics and the t-test results.
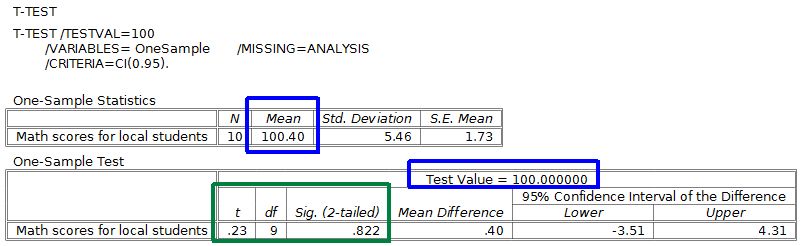
The means for the sample and the population are marked with blue. The one-sample t-test will compare these two means, which are quite similar, to determine if these are similar or different.
The t-test results for the t score, degrees of freedom, and the p value are marked in green. The p value is shown in the Sig. (2-tailed) field, where "Sig." is an abbreviation for statistical significance. This p value is much larger than .05, so we will keep the null hypothesis. Expressed differently, this difference is not statistically significant because our sample and the population means are essentially the same. Our local school kids are similar to national averages on this standardized test.
Home | Start | Variables | Data | Descriptive | Relationship | Inferential | Effect size | Advanced | Video
This work is licensed under a Creative Commons Attribution 4.0 International License that allows sharing, adapting, and remixing.