The paired-samples t-test compares means from groups that are related in some way. The most common research situation would be to compare a dependent variable measured before and after an experimental manipulation or a clinical treatment. These kinds of comparisons are commonly done in education and medical research. For example, an educator might want to compare students before and after instruction on a particular topic to see if the test scores have increased.
The t-test used for this situations is the paired t-test. This test is sometimes called the related-samples t-test or a dependent-samples t-test. We will call it a paired t-test because this is the terminology that PSPP uses.
The data for a paired t-test needs two variables, such as before (pre) and after (post) an intervention. In this example we will assume that an educator is comparing the math test scores for a class before and after instruction of a particular topic. The same people are tested repeatedly, so a paired t-test would be a good choice.
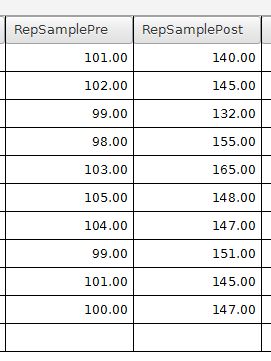
In this example, math test scores are shown before instruction (RepSamplePre) and after instruction (RepSamplePost). The Rep in the variable name is short for repeated, which means that these people have been tested at least two times. The labels for these variables are "Math Pre Score" and "Math Post Score".
The test can be started by going to the Analyze menu, then Compare Means, then Paired-Samples t-test. This will bring up a dialog box that looks like this:
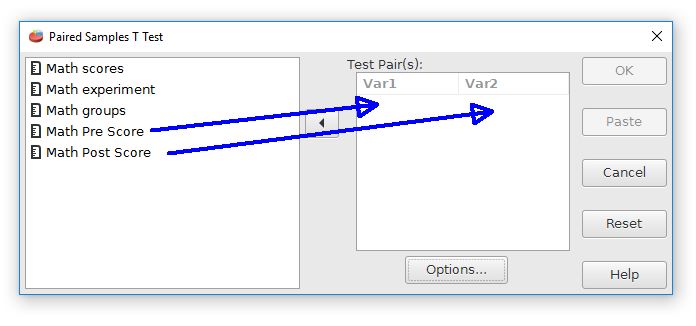
The paired variables need to be moved from the variable list at the left to the Var 1 and Var 2 fields in the center. Be careful to select just the paired variables, which are Math Pre Score and Math Post Score in this case. When finished, press the OK button to conduct the analysis.
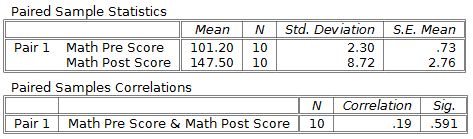
The output begins with descriptive statistics for each group. This analysis shows a large difference between groups, with an increase of about 46 points on this math test from before instruction to after instruction.
The right side of the bottom table of the output shows the t-test results:
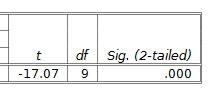
The APA style for reporting this result is t(9) = -17.07, p = .001. This test result is statistically significant because p < .05. It would be best to report this result as p < .001 rather than p = .000 because p values of zero are not really possible.
Note that the t-test result is negative, which suggests a decrease, but the real result is that an increase occurred between the pre score and the post score measurement. This contradiction occurs because the paired t-test computations subtract the second variable from the first variable. One strategy for dealing with this contradiction would be to enter the post variable as variable 1 and the pre variable as variable 2. The resulting change scores would then reflect the direct of the change. For example, an increase would be reflected as a positive t score. This approach is not absolutely necessary, but it might be useful in some situations to decrease potential confusion.
Home | Start | Variables | Data | Descriptive | Relationship | Inferential | Effect size | Advanced | Video
This work is licensed under a Creative Commons Attribution 4.0 International License that allows sharing, adapting, and remixing.