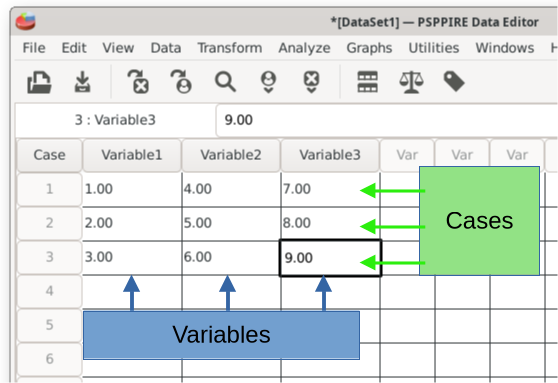
PSPP and other statistics applications follow a standard strategy for organizing data. The variables go into the columns, with each column representing a different variable. Examples of dependent variables that might go into a column are percent correct, heart rate, or temperature. Columns can also represent independent variables like membership in the control group or the experimental group.
The participant data goes into the rows, such as participant #1, #2, etc. Each participant has their own row. PSPP calls these "cases" and helpfully numbers them 1, 2, 3, etc. It might be a good idea to also include a variable with participant identification numbers to manage each person.
The intersection of row and data in each field represent's an individual's score on a particular variable. For example, Case #1 in this screenshot scored a 4 on variable 2. Case #2 scored 5 on variable 2.
Home | Start | Variables | Data | Descriptive | Relationship | Inferential | Effect size | Advanced | Video
This work is licensed under a Creative Commons Attribution 4.0 International License that allows sharing, adapting, and remixing.