
This work is licensed under a Creative Commons Attribution 4.0 International License that allows sharing, adapting, and remixing.
PSPP organizes data in a specific way. The variables go into the columns. Each column represents a different variable. For example, variables might be percent correct, heart rate, or temperature that represent a dependent variable. Variables might also represent an independent variable, such as membership in either the control group or the experimental group.
The participant data goes into the rows, such as participant #1, #2, etc.
In sum, the columns are the variables and the rows are the data from the individuals in the study. This understanding is essential to the data entry process.
If you start entering data in a blank sheet, the column heading will be named "Var0001", "Var0002", etc. The "Var" at the top of each column is short for "variable". The problem is that variable names like "Var0001" are just not very meaningful. The meaning may seem clear at the moment, but it might be hard to remember what each variable represents at a later point in time.
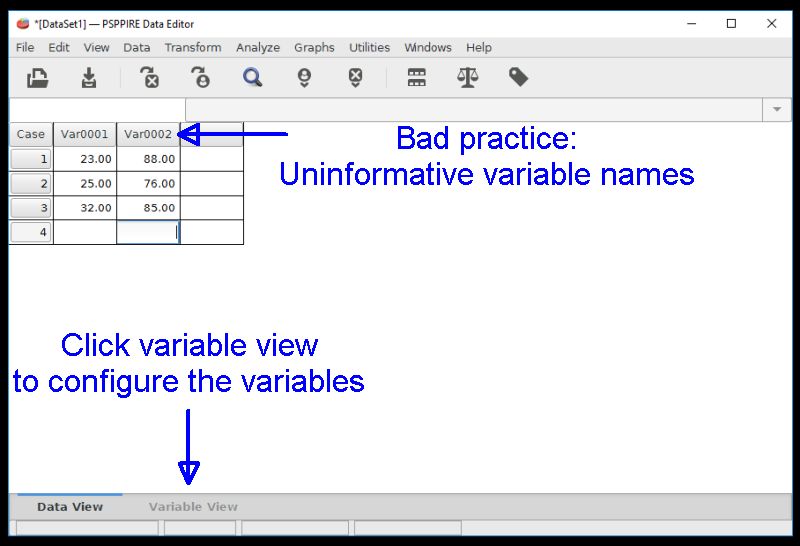
It's a good practice to begin by configuring the variables. Clicking on the "variable view" tab at the bottom left side will bring up a special data window for setting up the variables. You should always configure your variables before you begin entering data as a good statistical practice.
Index | Next - The Variable View
This work is licensed under a Creative Commons Attribution 4.0 International License that allows sharing, adapting, and remixing.