
This work is licensed under a Creative Commons Attribution 4.0 International License that allows sharing, adapting, and remixing.
PSPP has another powerful way to generate means for specific groups. It can is useful to repeat an analysis several times, such as a separate analysis for each category of a variable, when a group is broken down into smaller subgroups. For example, let's say that we want to know more than a class mean for the Exam1 variable. We might be interested to see separate means for the men and the women.
The Split File command is designed for these situations. The default setting of PSPP is to analyze all of the cases in the data view. Split File will change this so that the analysis output is done separately and repeated for each group. Splitting a file in this manner can easily produce means for separate subgroups.
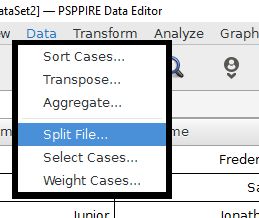
The Split File feature is under the Data menu.
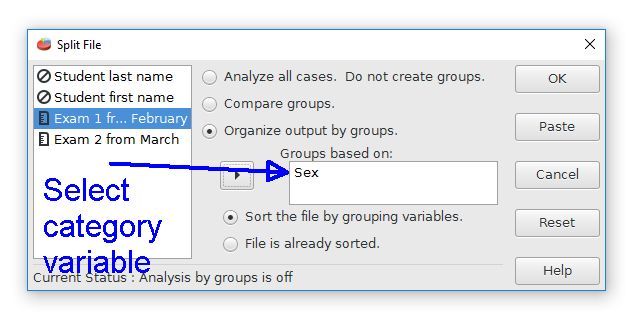
The Split File dialog box is set to "analyze all cases" by default. Selecting a categorical variable will split the data into groups, with any analysis being done separately for each group. We will select the Sex variable to calculate separate means for males and females on the exam grades.
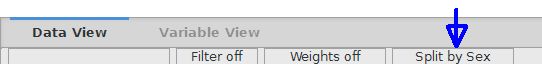
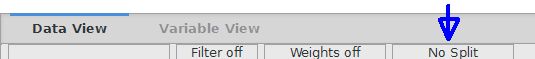
Pressing the OK button doesn't seem to do much. However, a subtle note that the bottom of the Data View now tells us that the file is "Split by Sex". This tells us that any analyses will be divided based on the Sex variable. The analysis will be done repeatedly for each category in the sex variable. Another change is that the data are now sorted by the Sex variable.
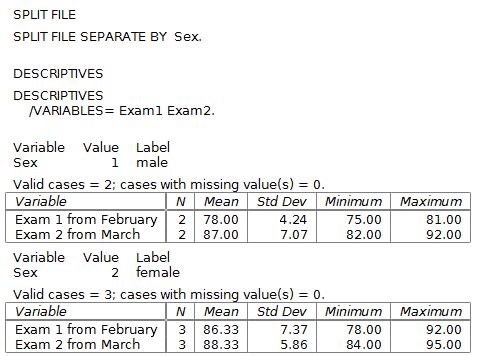
The next step is to redo the Descriptives command for Exam1 and Exam2 with the Split File feature. The output is shown below. First, note that the output has documented that the data are being split by the Sex variable. The analysis now has two tables, with the first table for males and the second table for females. For example, the male mean on Exam 1 was M = 78 whereas the female mean on Exam 1 was M = 86.33. This can be a powerful way to quickly calculate statistics for the subgroups of a study.
When the analysis is finished, be sure to turn the Split File feature off. Go back to the Data > Split File command and choose the "analyze all cases" option. The bottom of the Data View now shows that the Split File feature is off.
Index | Next - Histogram graphs
This work is licensed under a Creative Commons Attribution 4.0 International License that allows sharing, adapting, and remixing.