The Crosstabs command can be done when the categories are set for two classifying variables. See the Crosstabs data page for instructions about configuring the data.
The Crosstabs command is available from Analyze > Descriptive statistics > Crosstabs. For illustration, we will use the Sex and PoliticalParty variables from the previous CrossTabs example data. This will categorize people by their sex and political party. If you're interested in trying it, these data are available, in the file crossTabsData.sav.
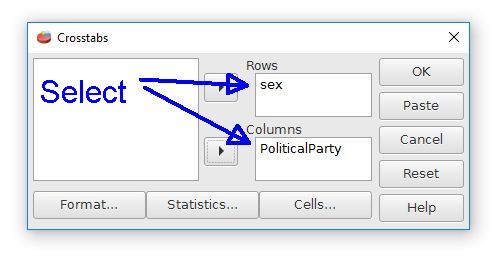
The analysis will need at least one categorical variable for the rows and at least one for the columns. The variables of Sex and PoliticalParty in this example will need to be moved right to the Row and Column fields to select them for the analysis. The Format and Statistics buttons have some additional options for the analyses.
The output will look like this:
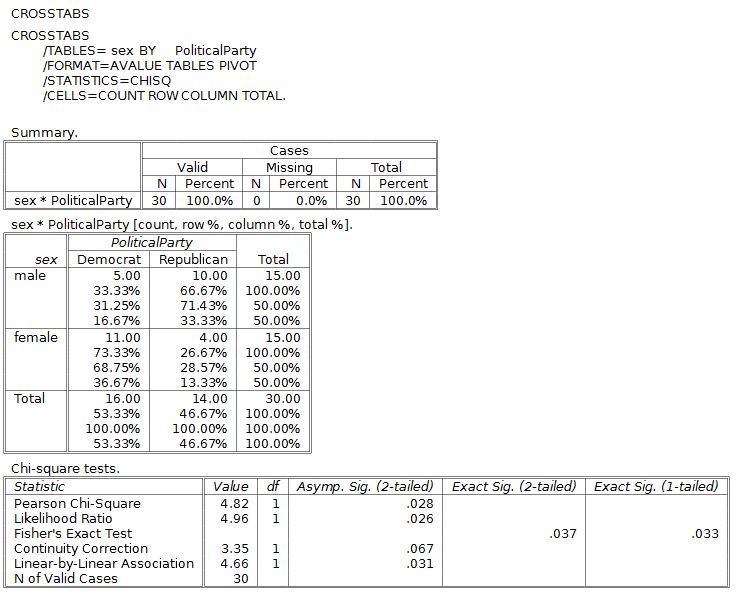
The most useful part of this output is the table in the middle, which displays the data categorized by both sex and final grades. Each cell has the frequencies at the top. The percentages reflect row percent, column percent, and total percent. If this is too much information, you can select fewer percentages in the dialog box the next time you run this analysis.
Something to note is that the row and column headings are male/female and Democrat/Republican. These labels are used because the Sex and PoliticalParty variables were configured in the Variable View with these specific Value Labels. If the variable labels were left blank, the column and row labels would be 1 and 2, which is confusing. It is well worth the effort to code these Value Labels for categorical variables before conducting the analysis.
The Chi-square test at the bottom of the output is a topic that we will return to later.
Home | Start | Variables | Data | Descriptive | Relationship | Inferential | Effect size | Advanced | Video
This work is licensed under a Creative Commons Attribution 4.0 International License that allows sharing, adapting, and remixing.