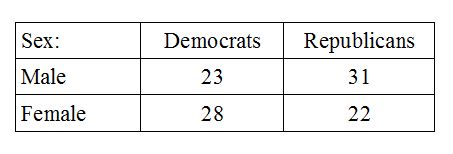
The Chi-squared test can also be used for more complicated classification schemes. Frequency data (nominal scale) can be categorized by two variables in some situations. For example, we could compare the frequencies of males and females who identify as either Democrats or Republicans. Each person is classified on two variables to form four separate groups in this example: Male Democrats, male Republicans, female Democrats, and female Republicans.
In this context the Chi-square test is sometimes called a test of independence. The data need to be coded to show each person's membership in two variables, as described for the crosstabs data. The data are available in this cross tabs formatted data file.
For Chi-square, run the crosstabs command from Analyze, Descriptive Statistics, Crosstabs.
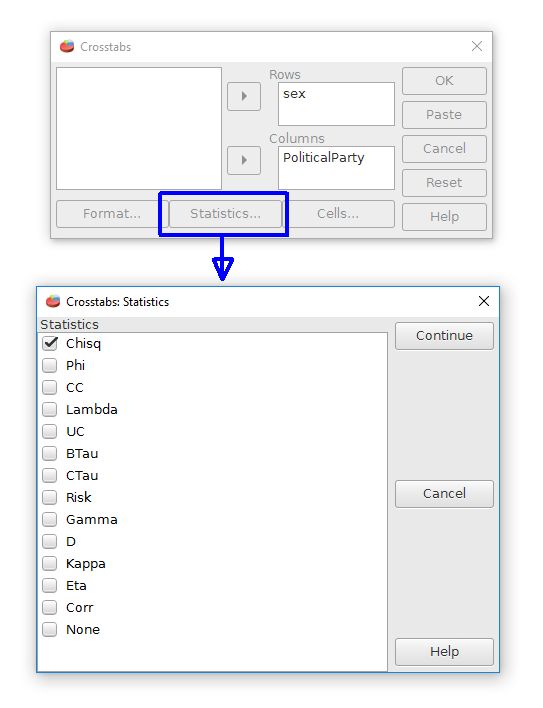
The two different classification variables, Sex and PoliticalParty in this example, must be moved to the row or column fields.
The statistics button from the Crosstabs dialog box reveals many different test possibilities. The Chi-square test is represented as "Chisq". Checking this box will yield a Chi-square test on the categories.
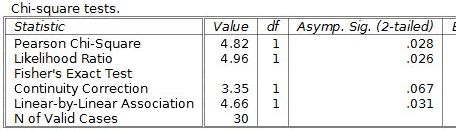
The Pearson chi-square row shows the chi-square test of independence results. For this example, it would be χ2 (1, n = 30) = 4.82, p = .028. This result is statistically significant because it has a p value < .05. The other rows represent less commonly used forms of the chi-square test.
Home | Start | Variables | Data | Descriptive | Relationship | Inferential | Effect size | Advanced | Video
This work is licensed under a Creative Commons Attribution 4.0 International License that allows sharing, adapting, and remixing.